如果你注意到网站加载时间变长,可能意味着出现了 过载。当主机资源的使用超过合理限制时,网站就会过载。你可以通过以下步骤在 cPanel 中找出网站过载的原因:
第 1 步 – 访问 Resource Usage
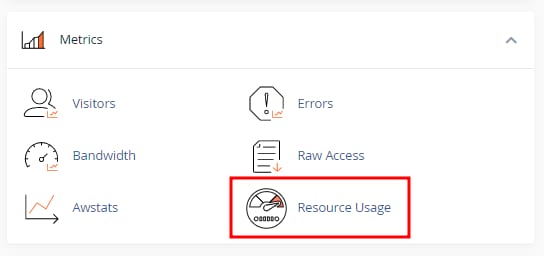
登录你的 cPanel 账户,进入 Metrics 板块并点击 Resource Usage:
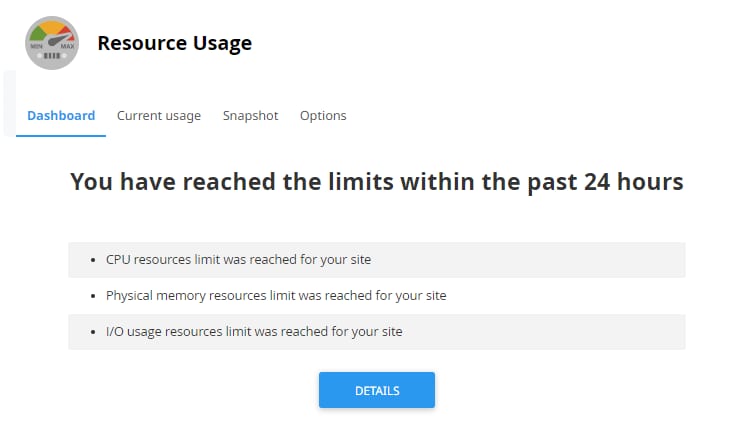
你也可以在搜索栏中输入它来找到该菜单。Resource Usage Dashboard 会显示主机资源的状态,如下所示:
- Your site had no issues in the past 24 hours – 你的网站已优化且未过载
- Your site has been limited within the past 24 hours – 表示你的网站已过载,你还可以看到哪些类型的资源超出了资源限制
- Your site might hit resource limits soon – 你的套餐资源限制已到达,网站即将过载。cPanel 还会显示超出限制的资源类型
第 2 步 – 查看资源使用详情
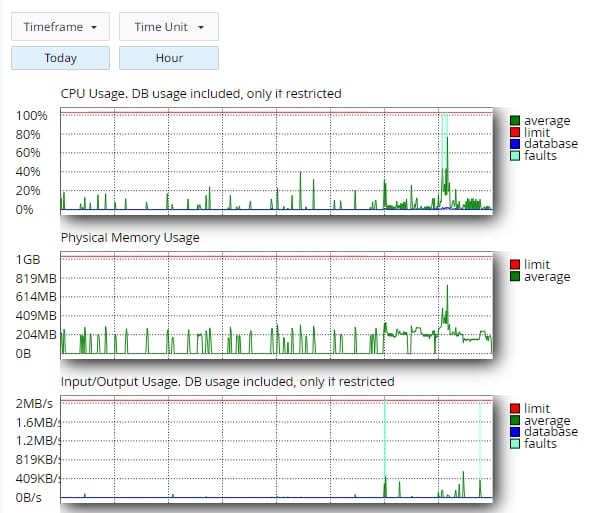
点击 Details 按钮或进入 the Current Usage 标签页,即可找出用量过高的原因。它会显示每种资源的详细信息,例如内存、CPU、inode 以及输入/输出:
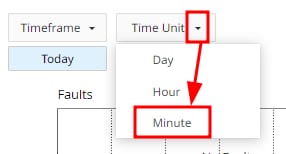
图表默认按天、每小时显示资源用量。若要更改这些设置,点击 Timeframe and Time Unit 下拉菜单选择其他选项,例如将时间单位改为分钟:
第 3 步 – 查看 Snapshots
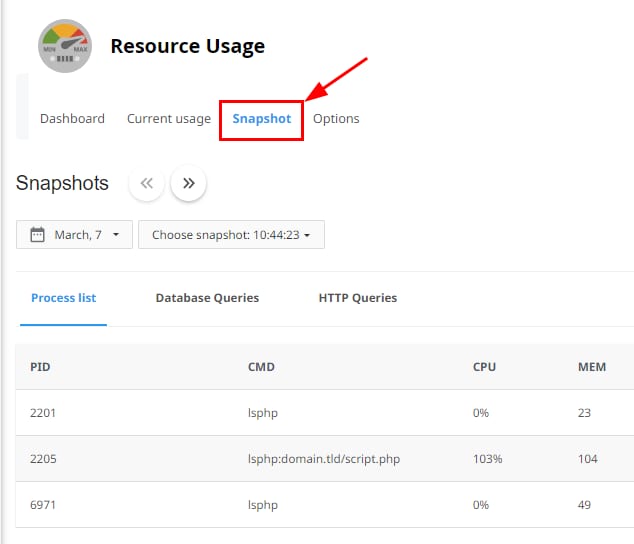
你还可以点击 Snapshot 标签页找出网站过载的原因,其中会列出所选时间段内的进程,如下例所示:
进程列表中显示四列,如下所示:
- PID – 进程 ID
- CMD – 进程名称
- CPU – CPU 使用率
- MEM – 已使用的内存量
在上例中,进程 script.php 的 CPU 使用率达到了 103%,超出了上限。这表明该脚本存在问题,拖慢了 CPU 性能。
要查看其他日期的网站过载问题,点击日期选择器,并在可用时点击 Choose snapshot 选择不同时间。
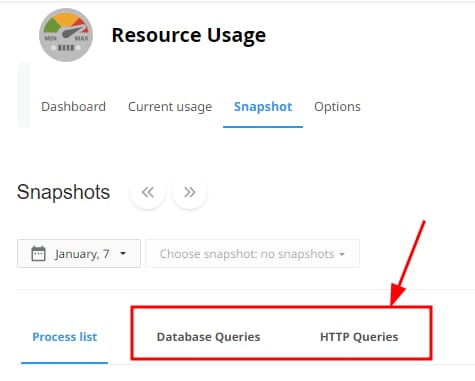
你还可以点击 Database Queries 和 HTTP Queries 标签页,找出数据库与 HTTP 进程中可能存在的问题:
来源:Hostinger 官方帮助文档